
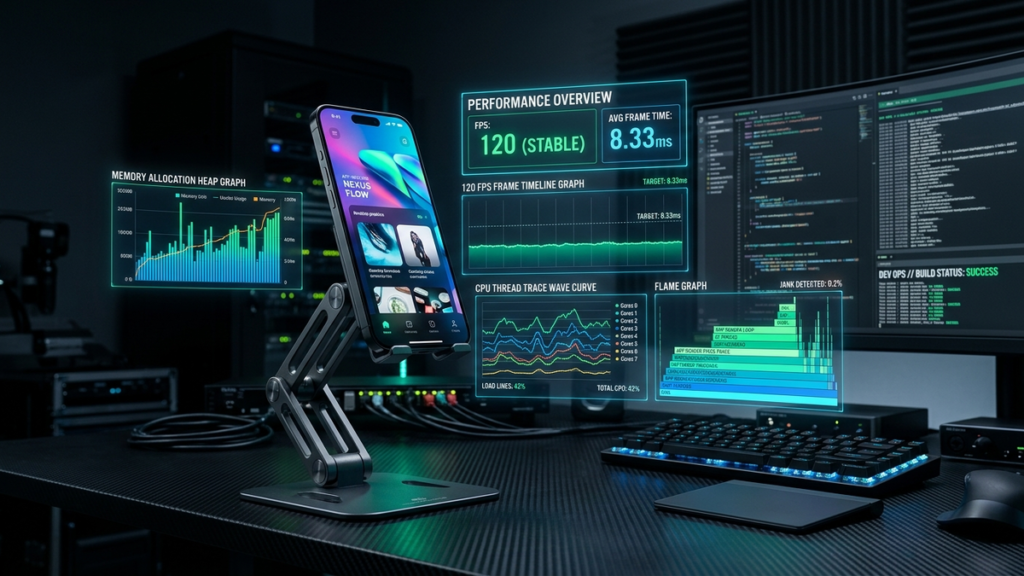
In the fiercely competitive mobile application landscape, performance is directly linked to business revenue and user retention. Extensive research across iOS and Android ecosystems confirms that a 100-millisecond delay in cold app startup time decreases user conversion by up to 7%, while frequent frame drops (UI jank) trigger instant 1-star reviews and app uninstalls. Modern mobile consumers demand fluid 120Hz ProMotion/Smooth Display rendering and instant interaction response.
At Ghayma LLC, our engineers treat performance as a foundational architectural constraint rather than a late-stage polish phase. In this masterclass, we explore low-level frame profiling, automated retain-cycle memory detection, and systemic cold-start optimization strategies.
1. The 120 FPS Rendering Budget: Surviving the 8.33ms Window
Modern flagship smartphones feature 120Hz refresh rates. This leaves the CPU and GPU exactly 8.33 milliseconds to compute layout, measure views, rasterize vector glyphs, and swap the display frame buffer. If the main UI thread is blocked for even 9 milliseconds, a frame is dropped, resulting in noticeable visual stutter.
Common Causes of Main Thread Starvation
- Synchronous Disk I/O: Reading cached SharedPreferences, SQLite files, or JSON configs directly on the main UI dispatcher.
- Heavy JSON Deserialization: Parsing large API payloads (e.g., 2MB of product records) on the main thread rather than offloading to background worker isolates.
- Excessive View Hierarchy Depth: Deeply nested layout trees that trigger exponential measurement and layout passes during scrolling.
2. Deconstructing Cold App Startup: The Pre-Main vs. Post-Main Phases
A cold launch occurs when the operating system creates a new process from scratch. Optimizing startup requires diagnosing two separate execution phases:
Phase 1: Pre-Main Execution (dyld / Android Runtime)
Before the first line of your app’s main() function executes, the dynamic linker must map dynamic libraries, rebase pointers, bind symbols, and execute static C++ initializers. To optimize Pre-Main:
- Merge dynamic frameworks into static libraries to minimize dylib load overhead.
- Eliminate static global constructors that perform hidden disk or network reads.
- Enable App Startup / Baseline Profiles on Android to guide Ahead-Of-Time (AOT) machine code compilation for core startup classes.
Phase 2: Post-Main Execution (Application Initialization)
In naive apps, the didFinishLaunchingWithOptions or Application.onCreate() method becomes a chaotic dumping ground for third-party SDK initializations (analytics, crash reporting, ads, remote configs, push notifications). High-performance apps implement an Asynchronous Dependency Graph Initializer: critical path services boot sequentially, while non-critical SDKs initialize lazily in background threads after the first frame renders.
3. Hunting Memory Leaks and Retain Cycles
Memory leaks in mobile apps lead directly to Out-Of-Memory (OOM) operating system terminations. On iOS, OOM crashes do not generate standard crash logs, making them notoriously difficult to detect without dedicated profiling.
The Swift Retain Cycle Hazard
In Swift, Automatic Reference Counting (ARC) handles memory. When two objects hold strong references to each other (most commonly within escaping closures), their reference count never drops to zero, leaking their entire object graph:
// Leaking Retain Cycle:
networkService.fetchProfile { [weak self] result in
    guard let self = self else { return }
    self.updateUI(with: result)
}
Always utilize [weak self] in escaping asynchronous closures, and audit ViewControllers using Xcode Instruments’ Leaks and Allocations profiler to verify deallocation upon screen dismissal.
4. Production Performance Telemetry: Measuring Android Vitals
Synthetic lab tests on developer MacBooks cannot replicate the diversity of low-end hardware across global markets. Production systems must continuously monitor real-world telemetry:
| Metric | Healthy Target | Critical Red Flag Threshold |
|---|---|---|
| Cold Startup Time | < 400 ms | > 2,500 ms (Triggers app abandonment) |
| Slow Rendering Frames (>16ms) | < 2.0% of all frames | > 5.0% (Degrades store ranking in Google Play) |
| Frozen Frames (>700ms) | < 0.05% | > 0.10% (Perceived as complete app crash) |
| ANR (Application Not Responding) | < 0.15% | > 0.47% (Google Play Vitale Bad Behavior threshold) |
“Performance is not an optimization pass conducted a week before release; it is an architectural discipline maintained in every single pull request.”
Conclusion
Achieving elite mobile performance requires scientific rigor, deep profiling intuition, and automated CI benchmarks. By enforcing strict frame rendering budgets, optimizing dynamic linking, auditing closures for memory leaks, and monitoring production vitals, engineering teams deliver blisteringly fast applications that delight users and dominate app store rankings.